These are our costs for our second motorhome trip to Europe, first through Belgium then Germany.
For an overall view and detail of where we went, including a map of where we stayed, please click on the map below, click on the tab at the top marked 'Our travels - where we've been' and then the link: 'Trip 9: Our third trip in Big Ted - Germany, France, Belgium, The Netherlands' (or click here). The map is interactive, click on any of the markers to open an information panel which details where we stayed, what it cost, photos of the location and links to the blog entry of that stop. The page 'Trip 9: Our third trip in Big Ted - Germany, France, Belgium, The Netherlands' contains a list of all our stops in date order with links to the relevant blog entries.
Here's our trip costs:
Overall total cost to date: £2829.74 (including insurance). Average daily cost: £42.87 (66 days)
Distance travelled since leaving The Midlands, UK on 6tb: October 2227 miles
Litres of diesel purchased: 429
Average fuel consumption: 23.6mpg
Average fuel cost/litre: £1.27
Travel insurance (2 people): We arranged European insurance through 'Big Cat', underwritten by AWP P&C SA, part of Allianz Group, single trip policy and took the 'Activity Pack' option as this covered us for a multitude of activities such as gorge walking, via ferrata, mountaineering up to 3000m and mountain biking (plus a host of other activities that we probably won't do). Cost: £174.36 for 70 days.
For more information on costs of each Aire/Stellplatz/campsite we stayed on, have a look at our travel map below. If you click on the little box with a left pointing arrow at the top left it brings up a list (go to full screen by pressing the box top right for a better view). Click on each of the items listed and a new window opens showing details of that site. It includes photos, links to blog entries of that stay and details of costs to stay there. To close click the left pointing arrow. It's also possible to access this information by clicking on any of the marker tabs on the map. Again, close each one by clicking the left pointing arrow.
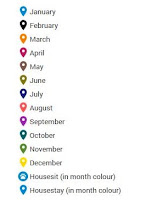
Key to pin colours:
This is how it looks in a pie chart split between costs:
And here is the expenditure in numbers in a spreadsheet:
And this is how it looks in a table:


No comments:
Post a Comment